We delight in sharing hard-won knowledge; there’s always a better way.
Language in Projects

The lights rise, and the ballerina curtsies. The audience applaud, delighted with the superb performance they have just seen. The dancers enter the stage, and take their bows, happy to share in the enjoyment they have brought.
At every performance the troupe have delivered consistently, exceeding the expectations of all who have seen their skill, movement and grace. Their secret to success? Years of training, testing and refining their skills, underpinned by a clear vision for each production, well planned and carefully choreographed. This vision is captured in a language, a language of dance that describes movement: benesh.
The Power of Antifragility

Anti-fragility is a brilliant concept, put forward by Taleb in his wonderful books: Fooled by Randomness, The Black Swan and Anti-fragility. These concepts can be applied to make projects stronger, and thrive on challenge.
As project professionals, our job is to deliver change. We steer our projects through complex and ever-changing environments, handling adversity to deliver on time, cost and scope. Threats arrive from all directions, both internal and external, and the longer the project runs, the more volatility it will be exposed to. Lack of knowledge, uncertainty and errors accumulate to generate more stress to the project and increase the risk of failure.
APM Midlands Presentation
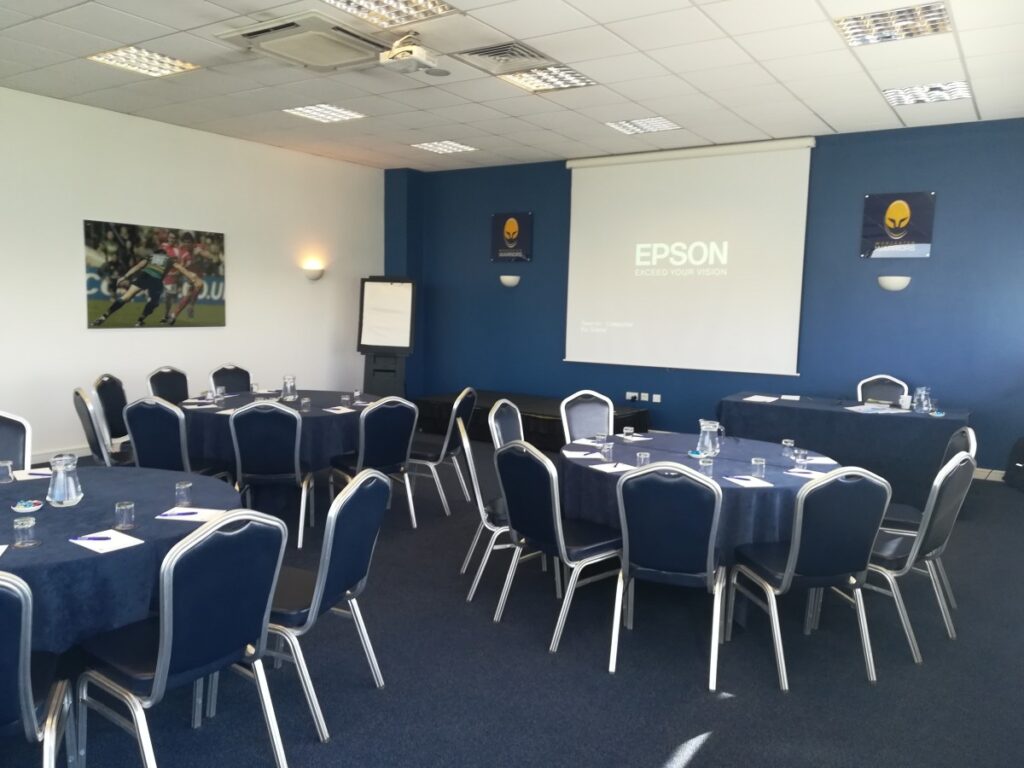
On Thursday 16 May 2019 I presented my talk “How do you know your project is on track? The role of data” to the APM Midlands branch in Worcester, at Sixways Stadium.
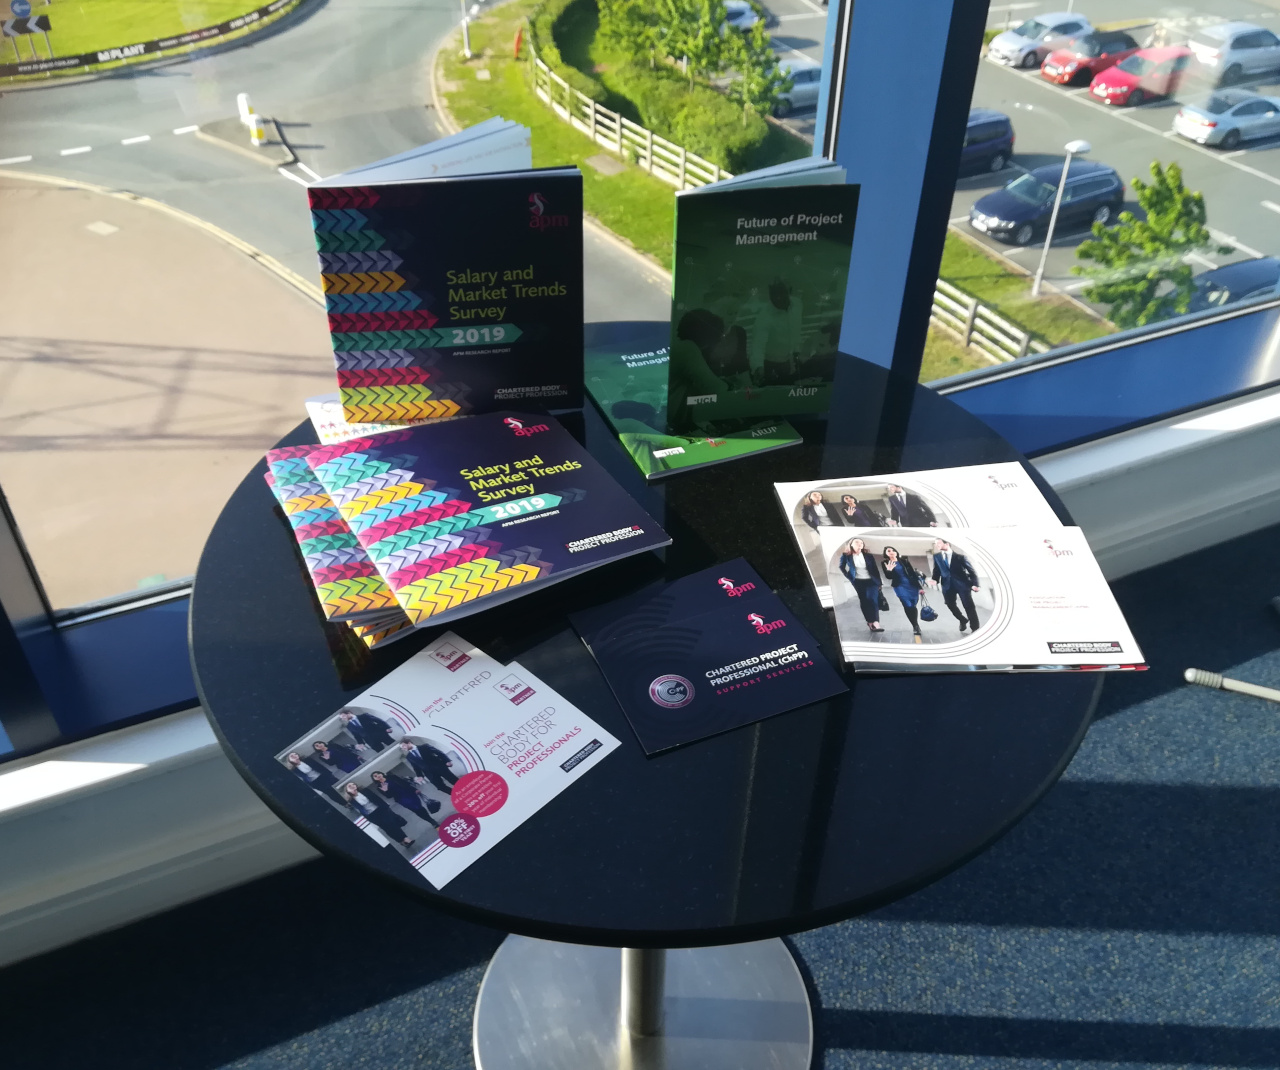 A great audience, with lots of interaction, generating ideas on how we can exploit data to deliver our projects predictably and with confidence. My thanks to the APM Midlands branch for organising the event.
EVA24 Presentation
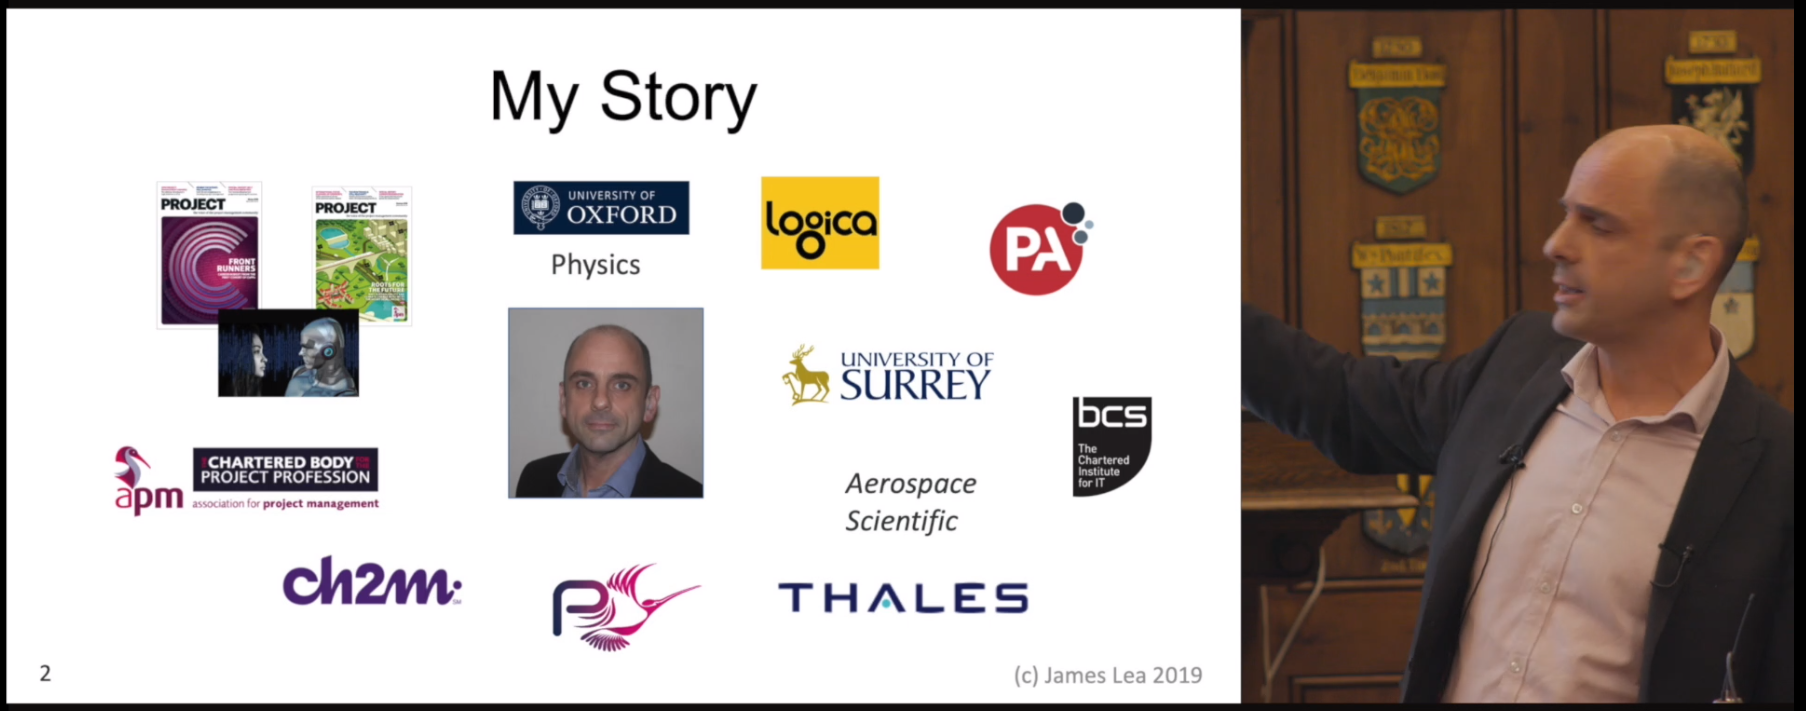
On 11 April 2019 I presented my talk “Placing Teams and Data Together at the Heart of Delivery” to the EVA 24 conference.
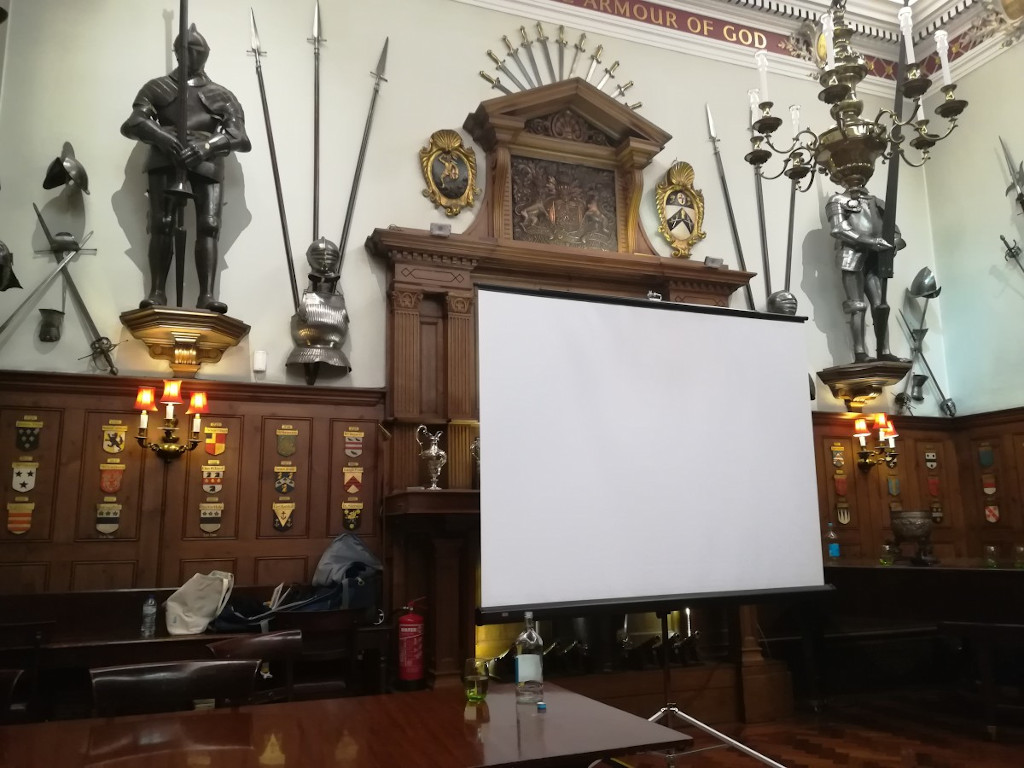
The Armourers’ Hall is the home of The Armourers & Brasiers’ Company, founded in 1322 as the guild overseeing the production of armour. More information at the Armourers’ Hall website.

Find out more
Get in touch with us to book a call. Working together, we will explore how to leverage the power of data in your organisation and generate competitive advantage.
APM Wessex Presentation
On Tuesday 12 March 2019 I presented my interactive workshop “How do you know your project is on track? The role of data” to the APM Wessex branch at Bournemouth University, Talbot Campus.
Find out more
Get in touch with us to book a call. Working together, we will explore how to leverage the power of data in your organisation and generate competitive advantage.
APM London Presentation
On Thursday 22 November 2018 I presented my talk ‘How do you know your project is on track? The role of data’ to the London branch of the APM. We shared ideas on how we can exploit data to deliver with confidence.
Find out more
Get in touch with us to book a call. Working together, we will explore how to leverage the power of data in your organisation and generate competitive advantage.
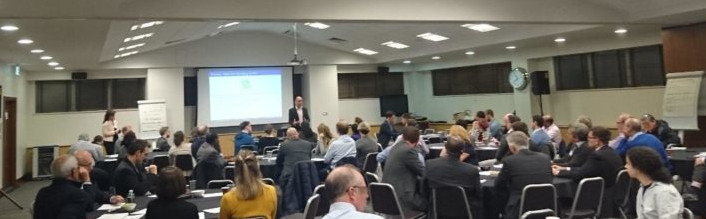
London Project Data Analytics Meetup 2018
I’m delighted to have presented at the London Project Data and Analytics Meetup on 22 October 2018. This event was organised by Martin Paver of Projecting Success.
In this interactive workshop I demonstrated using real-life case studies how a creative yet rigorous approach to data can be used to restore control and build delivery confidence, while also lifting team performance. Along the way I explored how good project design provides the foundations for applied AI techniques (including predictive analytics and machine learning).
Project Flow and Backflow
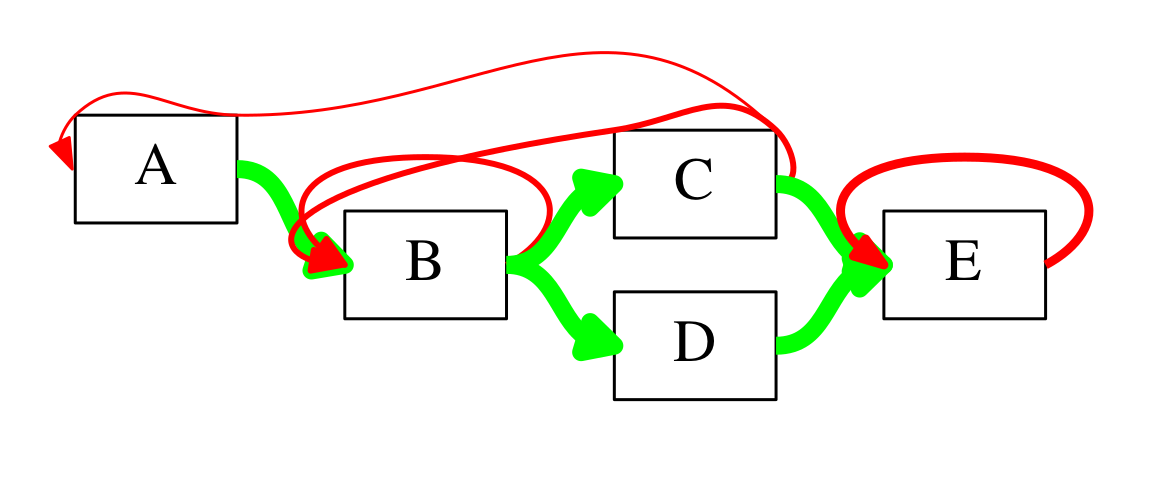
This is one of my favourite charts.
Project waste and backflow It shows a project as a classic network of activities, annotated with green and red lines. The green lines represent forward flow – the natural progression of tasks we desire in a smoothly flowing project. By contrast, the red lines represent back flow – the rework required to handle defects, errors, ambiguities and poor project design. The red lines are a major source of project volatility.
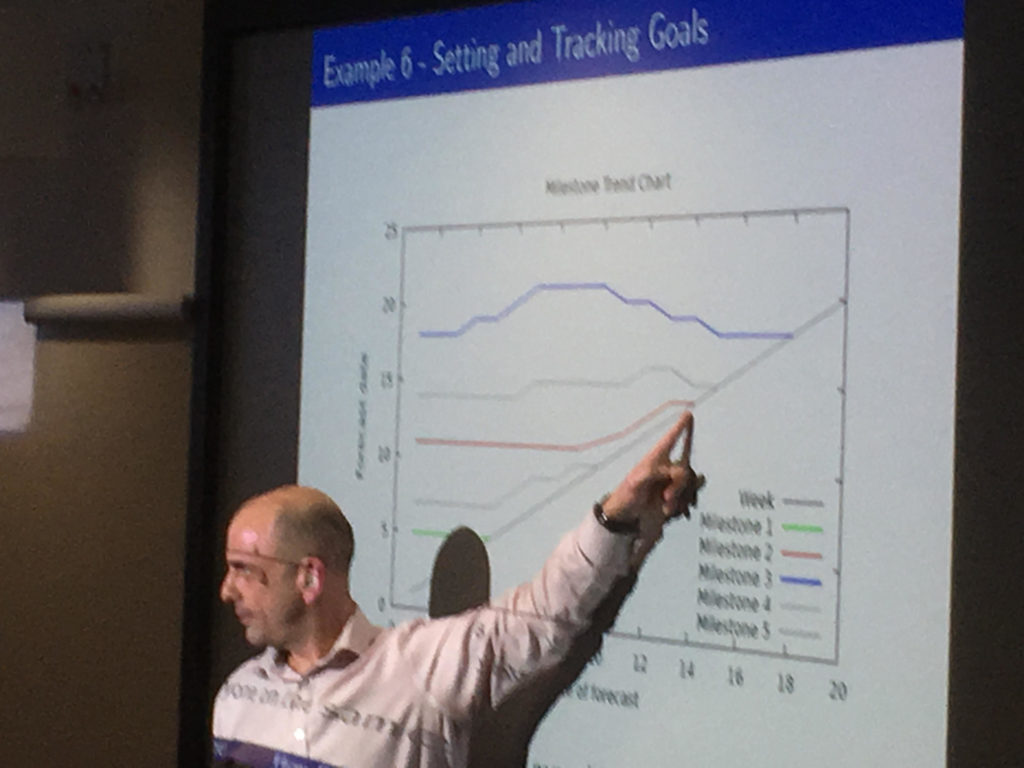
Milestone Trend Chart
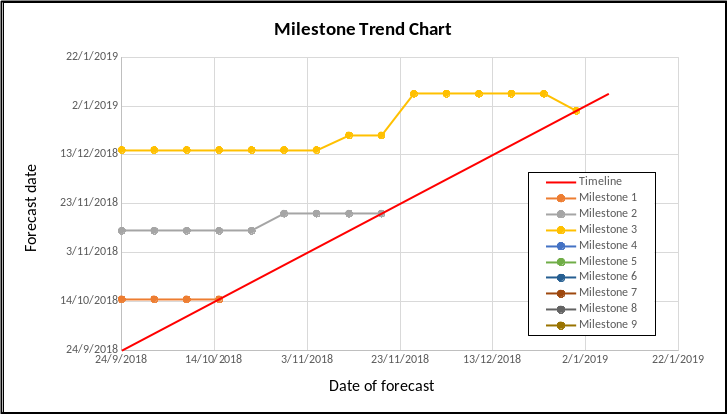
Milestone Trend Charts are a powerful tool for understanding and communicating what is to be delivered, when it will be delivered, and how stable the forecast delivery dates are.
Use these templates to help control your project and communicate delivery dates:
Remember: horizontal lines are stable forecasts; lines sloping up represents slips, and lines sloping down represent dates coming in earlier. A mature project will show slips or gains as early as possible, and not a week or two before the deadline is due.
BCS London Presentation 2018
On the 19th September 2018 I presented to the British Computer Society (BCS) project management specialist interest group (PROMS-G) in London. My talk is titled “How do you know your project is on track? The role of data”.
You can sign up here: https://www.bcs.org/content/ConWebDoc/59737.