Project Flow and Backflow
By James Lea
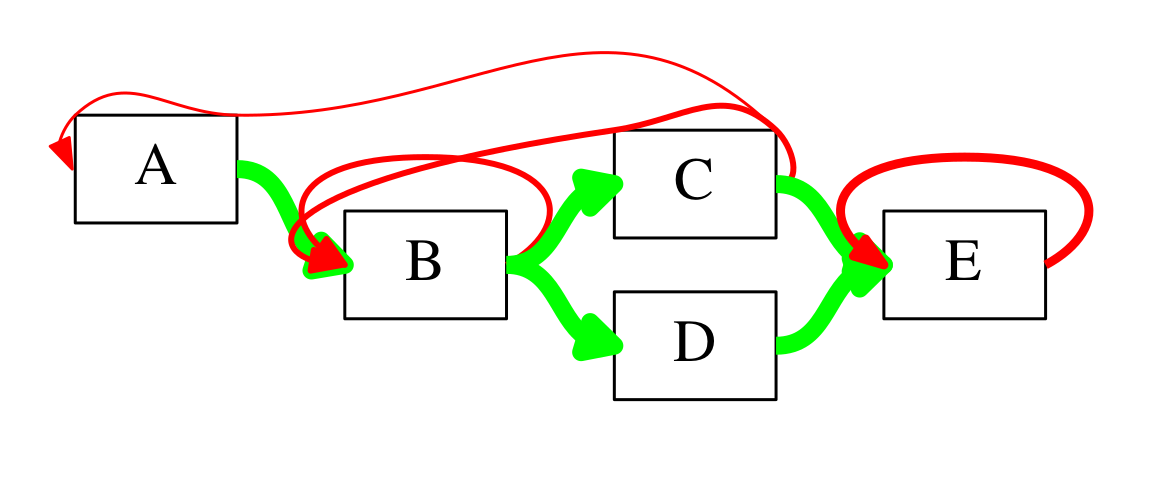
This is one of my favourite charts.
Project waste and backflow It shows a project as a classic network of activities, annotated with green and red lines. The green lines represent forward flow – the natural progression of tasks we desire in a smoothly flowing project. By contrast, the red lines represent back flow – the rework required to handle defects, errors, ambiguities and poor project design. The red lines are a major source of project volatility.
Are you doing everything in your power to design and execute your project properly to eliminate the waste and back flow?
Find out more
Get in touch with us to book a call. Working together, we will explore how to leverage the power of data in your organisation and generate competitive advantage.