Milestone Trend Chart
By James Lea
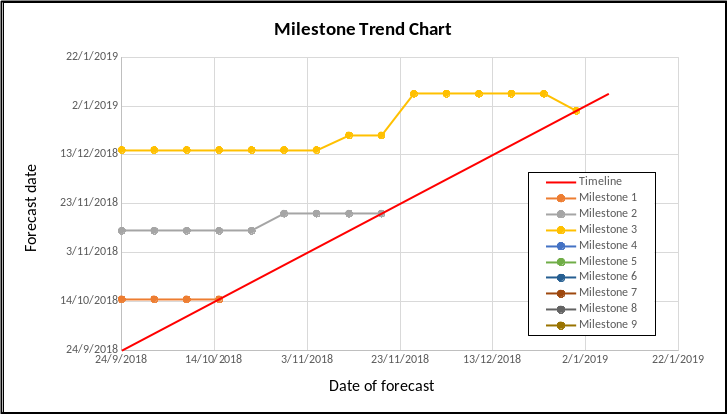
Milestone Trend Charts are a powerful tool for understanding and communicating what is to be delivered, when it will be delivered, and how stable the forecast delivery dates are.
Use these templates to help control your project and communicate delivery dates:
Remember: horizontal lines are stable forecasts; lines sloping up represents slips, and lines sloping down represent dates coming in earlier. A mature project will show slips or gains as early as possible, and not a week or two before the deadline is due.
Find out more
Get in touch with us to book a call. Working together, we will explore how to leverage the power of data in your organisation and generate competitive advantage.