Why should you embrace uncertainty?
By James Lea
Why should you embrace uncertainty?
Answer: to see the world differently. We can comprehend and turn uncertainty to our advantage. Here’s how.
In this short article I want to share some thoughts on how we can benefit from this way of thinking, along with a chart that you may find really useful.
Delivery Professionals
If you’re reading this, you’re likely to be a delivery professional. Someone who cares about outcomes. Regardless of your chosen methodology - be it agile, kanban, iterative, hybrid etc. - or your industry - physical construction, digital construction, services - we all ask questions, every day.
We ask questions when we’re:
Working out what we should do. Has this been done before? Who knows about this? If we didn’t do this work before, then who did, and how did it work out for them?
Calculating how much to commit. How long did it take last time? How much effort? How much might it cost? What are the ranges of outcomes?
Assigning the work. Who has the right skills? Are they available? Will they mesh and collaborate effectively with the existing team?
Figuring out what might happen and when. What are the risks? How likely are they? How should we respond? What risks happened last time? Could new opportunities arise this time?
Reporting. How do we tell the story? How do we convey our sense of confidence? What if we give the wrong picture? Are these charts accurate?
and so on.. hundreds of questions that we’re all asking.
All these questions are about building up a better picture - informed through data that gives rise to information.
Insights
The more you look, and the more you see, the less certain you are: but in a good way. You see the bigger picture and you recognise where you need to find out more. Those who don’t ask tend to think everything will be straightforward.
What has all this got to do with the chart?
As a data/information-driven product, project and programme manager, I handle uncertainty. I choose my approach, based on uncertainty and impact. If I’ve got a product I can iterate around, and stakeholders who prefer to say what good looks like when they see it (sometimes the “bring me a rock” game!), I go agile. If it’s high impact long timeframes, then it’s iterative. If it’s novel, and we don’t yet have a clear picture of the product, it’s R&D.
But in all of these, gauging uncertainty is at the core of my approach.
Which brings me to the chart.
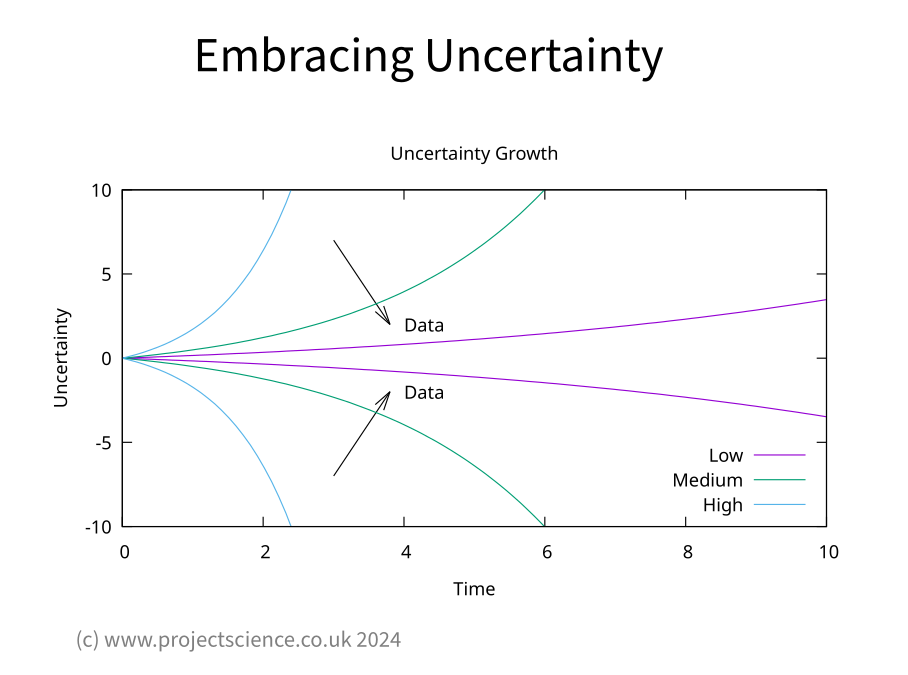
I present it in my webinars, and I love it. It shows how, the further ahead we attempt to predict - whether in time ‘or product space’, the less certain we are.
This chart distills my approach over 20 years, embracing uncertainty, and how I see data driving certainty. The better our data, the further ahead we can see. If we have insufficient data, uncertainty explodes - and we may not be able to predict two days ahead, never mind a month. But when we add data (shown by the arrows) we convert the high uncertainty growth scenarios into medium growth, and the medium growth scenarios into low growth.
We see further into the future, with sharper vision and greater clarity.
Embracing Uncertainty through Data at Scale
With data we can now do all the things we wanted to do, but at scale. We have rich, large language models making sense of unstructured data, generative AI producing content that gives us a flying start. We have a tremendous open source community giving us a plethora of powerful analytics and visualisation frameworks, such as Python, Pandas, Numpy, Scipy, Tensorflow, Matplotlib etc. There’s so much we can do.
When we embrace uncertainty with data, we build a continuous improvement cycle. We use data to learn from the past, and with that, we can get better at predicting - and shaping to our benefit - the future.
Find out more
Curious to find out more about our ground-breaking apps? Try out Predict for Jira, and Knowledge for Jira here:
https://marketplace.atlassian.com/vendors/1225571/project-science-ltd
Get in touch with us to book a call. Working together, we will explore how to leverage the power of data and AI in your organisation and generate competitive advantage.